Intel Kaby Lake: Cache Latencies
Introduction
In this post I use Cyclops to estimate the latencies of my Kaby Lake CPU’s L1D, L2 and L3 caches.
Methods
For this experiment I used the STRIDED_ARRAY workload, in which an array with
one element per 64-Byte cache line is processed.
Having one element per cache line ensures that each load doesn’t bring other
elements with it into cache.
Previous versions of the workload processed the array sequentially enabling the prefetcher to load future elements into cache ahead of time, hiding the true latency. To prevent prefetching, elements are now processed in a random order, where the index of the next element depends on the value of the current element.
I swept through different array sizes and recorded the results using this Cyclops command:
./cyclops \
    -w STRIDED_ARRAY \
    -m TASK_CLOCK_NS \
    -u 5 \
    -r 3 \
    -s array-size-kib=10:2800:20 \
    -p repeats=100
Here are some more general steps I took to reduce noise and increase accuracy:
- Pinned the thread to one core (Cyclops does this be default)
- Disabled SMT to prevent resource contention
- Disabled turbo frequency boost to reduce frequency scaling issues
Even with these measures, it still took a few attempts to produce the clean cache-boundaries in the figure below (mainly the L2/L3 boundary).
Results
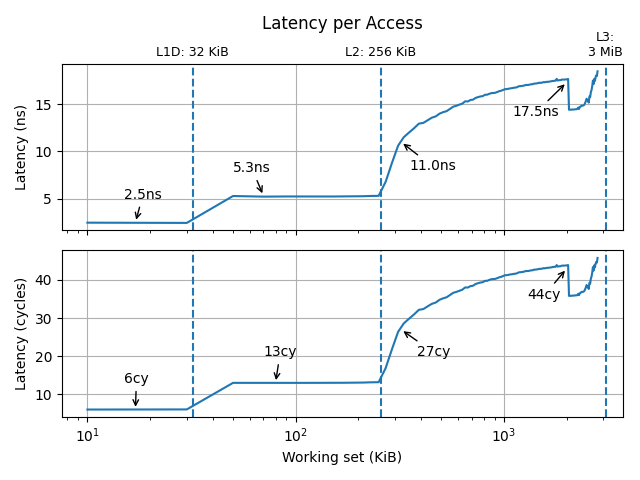
My results clearly show the jump in latency from the L1D cache to L2, with both producing singular flat values of 6 and 13 cycles respectively.
There is also a clear jump from L2 to L3, however the L3 cache produced a range of latencies rather than a single value. I estimated this range to be 27-44 cycles, generally increasing as the working-set grows.
The strangest feature of the curve is the sudden drop in latency from 2030-2050KiB. This is a robust feature that exists every time I repeat the experiment, suggesting the cause may be microarchitectural rather than something transient.
The L3 cache on Kaby Lake CPUs is shared between all cores unlike the L1D and L2 caches which are private per-core. It also has a more complex structure and is split into “slices” which I thought could be the cause of my strangely-shaped graph. However, after doing some reading, this seems unlikely since the slice that a cache-line is stored in is determined by a hash of its address, so the working set should stay evenly-distributed across slices as it grows. I would have to do more digging to come up with a good explanation.
I struggled to find official latency figures for Kaby Lake, but I was able to find data for Skylake, which is a very similar microarchitecture. Below is a table comparing my Kaby Lake results with Agner Fog’s work on Skylake, and Skylake minimum latencies from NASA:
| Cache | My Results | Agner’s Skylake Results | NASA’s Skylake Figures |
|---|---|---|---|
| L1D | 6cy | 4cy | 4cy |
| L2 | 13cy | 14cy | 12cy |
| L3 | 27-44cy | 34-85cy | 44cy |
My results are fairly consistent with Agner’s and NASA’s figures. My L1D latency measurement is a little high compared to theirs, which may be related to my workload implementation (for each iteration I calculate the array element’s address rather than doing a simple pointer dereference).
My L2 measurement is directly between Agner’s and NASA’s L2 figures.
Both me and Agner post a range of L3 latencies with significant overlap, although his range extends all the way up to 85 cycles. NASA’s L3 minimum latency is exactly at the upper bound of my range. It seems the L3 cache is a confusing subject!
Future Work
- Do more focused investigations on the structure and behaviour of the L3 cache
- Edit the Cyclops workload to do a pure pointer chase