Reverse Engineering my CPU’s Cache Sizes
In this investigation, I aim to estimate the sizes of my CPU’s L1D and LLC caches.
General Approach and Hypothesis
The approach I took was to process arrays of varying length and measure median cache miss rates for each array size.
Once the array exceeds the capacity of the CPU’s cache, I expect the cache misses to sharply increase since the array no longer fits entirely in the cache, and some reads will need to go to RAM or the next-level cache.
Thus, by plotting cache the cache miss rate against array size, I should be able to estimate the size of my cache.
Methods
Workload
I use the STRIDED_ARRAY workload for this investigation.
With this workload I can “process” an array, setting the number of elements
at runtime with the array-elements workload param.
I keep the array stride (stride-bytes param) constant at the default value of
64 Bytes, resulting in arrays of (64 * array-elements) Bytes.
We want to have one element per cache line (64 Bytes) because it is cache lines that are cached, rather than individual Bytes.
During the processing of the array, the workload uses a random-access pattern to access array elements instead of processing them sequentially. This defeats the prefetcher, which would otherwise reduce the clarity of the results.
Metric Groups
I use the following metric groups to record cache miss rates:
L1D_READSfor L1 data cacheLLC_READSfor L3 cache
Warmup Runs
For each array size, I perform several warmup runs (e.g. -u 5) to initialise
the caches.
This avoids the first few recorded runs of the batch having elevated miss rates
due to cold caches.
Final Cyclops Commands
./cyclops \
    -u 5 \
    -r 5 \
    -w STRIDED_ARRAY \
    -m L1D_READS \
    -s array-elements=100:50000:100

./cyclops \
    -u 5 \
    -r 5 \
    -w STRIDED_ARRAY \
    -m LLC_READS \
    -s array-elements=50000:1000000:10000
Results
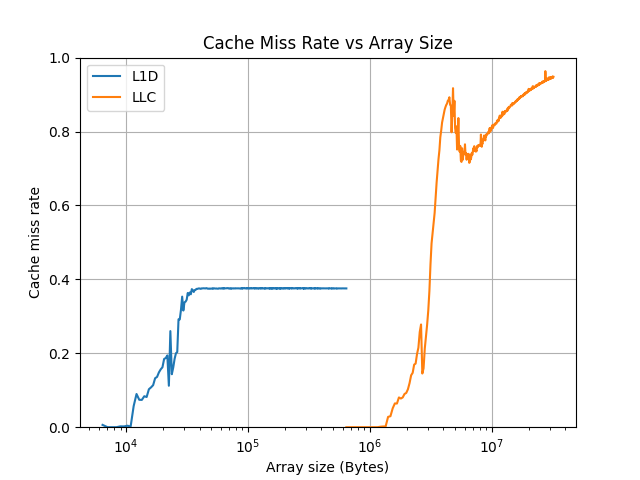
The figure above does show clear increases in cache miss rates:
- between 2*10^4 and 4*10^4 Bytes for L1D
- between 2*10^6 and 4*10^6 Bytes for LLC (L3)
These ranges align with the actual cache sizes for my CPU:
- L1D: 32KiB per physical core
- L3: 3MiB
SUCCESS!
Questions
Here are some questions and ideas for future investigations I have:
- Why does the LLC curve spike at ~3MiB, then go down, then follow a smooth curve upwards towards 100% misses?
- For both curves, why is there a smaller spike right before the main spike?